A buyer comparing Dover Shores against Eastbluff or Corona del Mar this summer ran into a strange problem. A current active-listing snapshot for July 2026 put the median at $7.65 million. A trailing 12-month view of closed sales, covering the same streets and the same zip code, put the median at $6.75 million. A separate automated valuation model listed $5.5 million for that same month. None of these numbers are fabricated. All three are, in a narrow sense, correct. And none of them tell a buyer or seller what a house in Dover Shores is actually worth.
The reason isn't sloppy data. It's math doing exactly what math does when you feed it a tiny sample.
The problem is the sample size, not the source
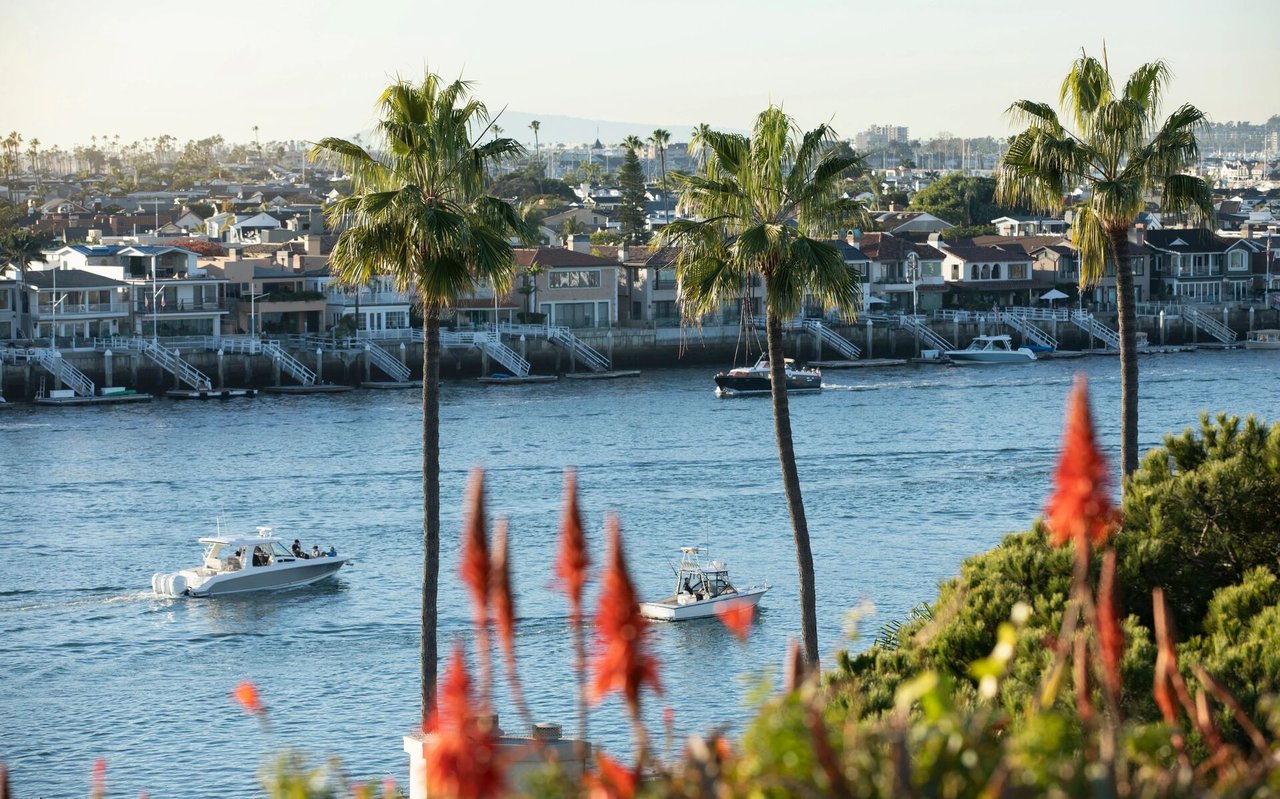
Dover Shores is a small, built-out enclave on the west side of Upper Newport Bay, developed mostly in the 1960s with a mix of original ranch homes and newer rebuilds. In early July 2026, public listing data showed only six single-family homes actively for sale in the entire neighborhood, ranging from $5.5 million to $12.995 million. When your entire dataset for the month is six houses, and one of them is a brand-new architectural estate on a 13,000-square-foot lot while another is a 1960s ranch on a standard interior lot, the median doesn't describe a market. It describes whichever six houses happened to be listed that week.
Swap out the $12.995 million architectural estate for a modest bayfront remodel and the median can move by hundreds of thousands of dollars without a single buyer or seller changing their mind about anything. Swap a 12-month trailing average for a live snapshot of active listings and you'll get two different numbers from the exact same underlying market, because one is measuring what already closed and the other is measuring what sellers are asking for right now. That gap, sometimes over a million dollars in a given month, is not volatility. It's methodology.
Compare that to Newport Beach citywide figures from around the same period in early July 2026, where average home value and median sale price both sat closer to $3.6 to $3.7 million. Dover Shores was running nearly double the citywide figure, which tells a buyer something useful: this neighborhood does not behave like a citywide comparison, and treating its median as a stand-in for "Newport Beach pricing" will mislead you in both directions.
What actually moves the number: frontage you can use, not frontage you can see
If median price is the wrong tool, price per square foot on individual streets tells a sharper story, and the pattern in Dover Shores is consistent. The premium isn't paid for being near the water. It's paid for water you can actually put a boat in.
301 Morning Star Lane sold in January 2026 for $16.5 million after asking $17.995 million, a closing price that works out to roughly $2,500 per square foot. Public marketing on the home cited about 148 feet of bay frontage and a private dock, the kind of usable footage that supports serious boat storage rather than a decorative view. A few streets over, 508 Evening Star Lane, also water-adjacent, has publicly listed closer to $1,036 per square foot, less than half. The difference isn't the ZIP code or the school assignment. It's what the dock, or the absence of a functional one, allows an owner to do.
The same pattern shows up on Galaxy Drive and Dover Drive. 1424 Galaxy Drive has listed near $2,269 per square foot, close to a park and to usable water access, while 1312 Dover Drive, set back from the bay, has listed closer to $1,454. Other public examples reinforce the same idea: 225 N Star Lane markets a southerly orientation with a dock built to accommodate a large yacht, and 1018 Polaris Drive advertises a dock sized for two boats plus a Duffy. Those aren't just amenities. They're the line item that separates a $1,000-per-square-foot home from a $2,500-per-square-foot home on the same body of water.
For a buyer, this changes the question you should be asking. "Is it on the bay" is the wrong filter. "What is the permitted dock capacity, and how many feet of usable frontage does the lot carry" is the one that actually prices the house. Newport Beach's own harbor planning documents describe conditions under which docks are permitted bayward of waterfront residential parcels, which means frontage on a map and frontage with an approved, buildable dock are not the same asset, and a buyer should confirm which one they're purchasing before anchoring to a per-square-foot comparison.
The private beaches change the math for everyone else
Not every Dover Shores buyer is chasing dock capacity, and the neighborhood's structure accounts for that. Residents have key-fob access to three private beaches that function as a kind of shared amenity layer independent of individual lot frontage. Fisherman's Beach has storage and a launch point for small boats. Larry's Beach has barbecue pits and a playground. North Star Beach sits beside the Newport Aquatic Center, where residents can rent kayaks and paddleboards without owning a dock at all.
That matters for the median problem too. A buyer who chooses an inland ranch home with no personal water frontage still gets bay access through these gated beaches, which means the neighborhood contains two legitimate ways to buy into the water lifestyle: pay the dock premium for a private frontage lot, or buy inland and use the shared beaches. A single median price flattens both of these into one number, which is precisely why the number keeps moving depending on which type of buyer closed that month.
Galaxy View Park and Westcliff Park round out the outdoor picture with sunset viewpoints, and the Back Bay Loop, a roughly 10.5-mile path around Upper Newport Bay documented by the Newport Bay Conservancy, gives both frontage owners and inland owners the same walking and cycling access regardless of which side of the price gap they landed on.
The daily-life layer that doesn't show up in either number
None of the pricing mechanics above touch what it's actually like to live there day to day, and that context matters when a buyer is weighing a dock premium against a lower-priced inland home. Westcliff Drive, the closest commercial strip, carries Keán Coffee Artisan Roasters for a daily espresso run, Olea a few doors down for New American dinners, and Ralphs Fresh Fare and Sprouts Farmers Market for groceries. Fashion Island and Lido Marina Village sit a short drive away for anything beyond that. Mariners Elementary is part of the neighborhood picture. None of this shows up in a per-square-foot table, but it's the difference between a house that prices well on paper and a neighborhood someone actually wants to live in.
The takeaway for a comparison shopper
If you're cross-shopping Dover Shores against Eastbluff, Newport Heights, or Corona del Mar, stop treating the quoted median as a fixed data point and start treating it as a symptom of a thin, lumpy market. Ask for the actual comparable sales from the trailing few months, not a portal's blended average. Ask whether the frontage on a specific lot carries a permitted, buildable dock or simply a water view. And decide up front whether you're buying private frontage or buying into the shared beach system, because both are legitimate paths into the same neighborhood, priced very differently, and no single median will tell you which one you're looking at.
Understanding where a specific address falls on that spectrum, rather than anchoring to whatever number a portal displayed last, is the difference between negotiating from data and negotiating from a guess. If you're comparing Dover Shores against other Newport Beach neighborhoods and want the comparable sales behind the headline number, Brian Liberto can walk through the specific streets and dock permits that actually set price in this market. Let's Connect.
This article is general information, not legal, tax or financial advice. Consult a qualified professional about your situation.